Importance of Data Visualization
Data visualization is a powerful tool that transforms complex datasets into visual formats, making it easier to understand trends, patterns, and insights. In an age where data-driven decision-making is crucial, effective visualization can significantly enhance communication and comprehension.
Overview of Best Practices
Creating engaging, dynamic, and relevant data visualizations is essential for making a lasting impact on your audience. Whether you're a beginner or an experienced data analyst, crafting a visualization that effectively communicates insights requires careful consideration. When done right, visualizations not only tell a compelling story but also reveal hidden insights that might not be apparent in raw data or basic charts.
Before tackling the specifics of your visualization, define your goals. Clarifying these will guide your decisions on what data to include.
Consider asking yourself these questions:
-
Who is my target audience?
- What questions are they looking to answer?
- What insights am I uncovering for them?
- What key message do I want to convey?
- What other questions or discussions might my visualization spark?
Once you're clear on your objectives, follow these tips and techniques to ensure your visualization is intuitive, impactful, and easy to interpret. By doing so, you'll deliver clear messages that engage viewers and provide them with valuable, actionable takeaways.
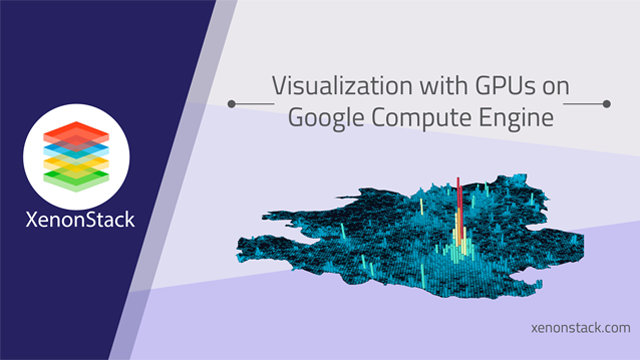
Three-dimensional visualization can be used for morphological correlation between different classes of volumetric data, such as those acquired using different types of
10 Best Practices for Data Visualization
We all want our Business Intelligence (BI) and analytics solutions to transform data into insights. However, the data is handy only if understood and shared better. In this section, we will be listing the best practices below:
Entitle a specific audience and mark their needs
Constructing visualization and putting all of them together into a dashboard is not a way of providing customer data. There might be chances that one is not fit for all. We must put more effort into sharing performance with others, monitoring behaviour, and measuring effectiveness.
We have to answer these questions also:-
-
For whom are we designing visualization?
While designing a dashboard, we must know our priority persona. What challenges are we facing? How do we solve these challenges? Then, design the dashboard to meet all the users' requirements.
-
What decision do I need the user to make?
It must answer what decision I should take. Is this decision risky? Is this profitable or not? Whether I buy this property or not. Sometimes, a decision must be answered multiple times a day or even a week or month at a meeting. So, the visualization should be created in such a way that it will give you a binary response.
Get more information related to data visualization
Choose the Right visual (The Key)
Once you know your audience and the data, it is time to select the correct type of visual that best expresses the information included in the data:
-
Line Chart - A line chart represents continuous data with minor changes. It works well for a large number of values with different time intervals.
-
Bar Chart - When we want to compare data, we can use a horizontal or vertical bar chart. For example, we can compare the time spent on a smartphone and which field had the highest profit or the paid and unpaid apps downloaded by different types of gadgets.
-
Pie Chart - The pie chart is mainly used to represent the proportion or percentage of data. It is useful when we have less than seven categories. It also helps determine what percentage that particular category holds.
-
Column Chart - It is used when we want to compare various categories with subcategories. It is also used to compare multiple items within a particular range. In this example, we compare the profit of a particular product in a specific country.
-
Area Chart - It is good practice to use area charts to show how values develop with time. This method is mainly used when we want to know the exact share of a particular category. It helps to represent a significant difference between values.
Apply Text Carefully and Intentionally
Put all the vital points at the top or upper left corner because the human eye is drawn to that place first. Try to add three or four views in a single dashboard, as it is one of the best practices. If we add too many graphs, it will be difficult to understand. When applying multiple filters, group them and add a border around them to make them more transparent and attractive.
Use the Predictable Pattern for Layouts
Human eyes quickly catch indicators that help in understanding important information. You usually grab designs; if they are random or don’t make sense, sometimes it is tough to understand what visualization wants to communicate. To know about human thinking, we must represent data that makes sense to viewers, whether sequential or numeric. If you are using no graphs, ensure the chart is appropriately visible, and connections between data should be clear. Please don’t confuse your viewers, as it is not counted in its best practices, and users can quickly go from one point to another.
Select the Right Data Visualization Tool
The data visualization tools differ from developers to data engineers, data analysts, and BI engineers. Some of the Tools that are Famous among the community are -
- Echart
- Highchart
- Tableau
- Fine BI
- Power BI
- Ali DataV
- FineReport
- Digital Hail
Data Visualization is the graphical representation of information and data. By using visual elements like charts, graphs, and maps, data visualization tools provide an accessible way to see and understand trends, outliers, and patterns in data.
Use attractive colours for telling Data Stories
Colours play an important role in depicting graphs without using words. It helps to communicate a lot about your visuals. Try to keep it simple, as it is one of the best practices. Using colour to highlight essential points helps users understand the dashboard more frequently and quickly. Proper Color clubbing matters a lot. The viewer can understand faster and promptly try to use natural colours. For example, in a graph, different shades of particular colours are used to show a profit for a specific month, and the brightest for a month has the highest benefit.
Use attractive and straightforward Dashboards
As we know, the dashboard usually contains many graphs, so try to add three or four charts or graphs for better understanding. Try to use different colours for different figures for better knowledge of viewers because the dashboard is the main thing that will help the viewers to get the result and make decisions accordingly. If the dashboard is clear and attractive, it helps to grab the viewer’s attention.
Explore more about the use of dashboards in data visualization.
Design in such a way that the user should be engaged
Designing the dashboard where the user should be engaged is one of the most critical data visualization strategies. For compiling data into data, visualization consistency is essential. A great visualization helps the observer to conclude faster and more efficiently. They perfectly show data. Display on the data hierarchy supports the observer in making a decision quickly. The designer can sort the data from highest to lowest to highlight the most crucial point to the viewer in the most prominent way. Even in the order in which we display data, the colours, font, and other elements in charts help viewers interpret data more efficiently.
Try to make visualization inclusive
How we represent data using different colours helps people understand the dashboard better. According to a recent review, it is a critical factor in observer decisions. People responded to other colour combinations faster than similar colours used in charts. Using identical colours with fewer contrasts creates difficulty for average viewers, sometimes even more difficult for those with vision problems. Its best practices include using the right contrast combination. To convey different types of information, try to use different patterns. For label elements, try to use text and icons.
Examine Business Insights and Analytics
In this competitive world, it is tough to find data interaction. This is one of the most essential best practices emphasising finding data correlation in business insights. Examining these insights is very important for every business so that they can set the right track for achieving their goals. It also helps in getting knowledge of the latest trends and providing a quality product to customers. It also helps in finding a problem before it arises. You can stay at the top of trends, which enables you to increase your profit
Data Visualization techniques and strategies
Its strategy is another on the rundown. You may have the information scrubbed and the bits of knowledge removed, yet you should likewise understand how to manage all the fortune.
Better Preparation and Investigation
Information system guesses numerous means, from examining the business sector and industry, picking and organizing information streams — constant or heritage, inner or outer, or both, and so on., to choosing apparatuses and hotspots for information preparation and investigation — manual information researcher examination, front line AI calculations.
Identify Areas that need Attention.
As indicated by an Experian report, 95% of U.S. associations state that they use data to control business openings. Another 84% accept information as an essential piece of shaping a business system. With an exponentially developing volume of data, chiefs might appear wealthy and ought to prepare to receive liberal rewards from their increasing resources. Nonetheless, more isn't always better.
Quick Action
Managing a lot of information can be overpowering and "suffocating" if organizations don't settle specific difficulties before entering an information-driven period.
Interactive Representation of Data
The way we present information significantly impacts information investigation and deciphers a large amount of information in a continuous structure by using complex arrangements of numerical or verifiable figures. With the vast surges of information promptly accessible to the present organizations across ventures, the test lies in information understanding, which is essential to the individual association, as well as its points, objectives, and long-term targets. Best use of Data The information is essential for the accompanying performance of your business and to help you get the most imaginable incentive. From this, I attempted and tried methods for dissecting and introducing crucial data.
What's Next?
Incorporate these data visualization best practices, and you'll set a strong foundation for creating impactful visuals with XenonStack's solutions. To further refine your skills, explore our detailed guide on crafting dashboards that users love, ensuring clarity, engagement, and actionable insights.


