
.webp?width=1921&height=622&name=usecase-banner%20(1).webp)
Effectively representing data is one of the critical tasks in data visualization. In JavaScript, various libraries, both open-source and commercial, allow this task to be performed easily. Here, we are going to list 16 of the most popular and easy-to-use JS visualization libraries.
What is Data Visualization?
A graphical representation of data and information is the meaning of Data Visualization. Using visual templates like layouts, outlines, and maps, open-source data visualization tools provide an accessible method to see and understand patterns, individual cases, and models in data. Today, these tools and technologies are necessary to analyze large amounts of data and make data-driven decisions.
Data visualization is the control of the pursuit to appreciate the data by setting it in a visual setting with the aim that examples, arrangements, and relations that may not work in any case it is used to be analyzed can be disclosed. However, in today’s world, the different standard Data Visualization software tools, outlines, and information representation devices slack diagrams. Immediately to display information in a progressively leading appearance, infographics, dashboards, geographic maps, sparkle lines, heat maps, full bar, pie, and fever diagrams go past that customary route for the showing of information. More now, sharp pictures come into force, and the client can control information for analysis and querying.

Why Data Visualization Matters for Insights
In Business Intelligence (BI), information representation is an integral part of displaying and communicating data. There are two major players in BI: Tableau and Qlik. These platforms heavily emphasize visualization, and almost all Business Intelligence Software includes robust data visualization functionality.
Additionally, visualization plays a crucial role in advanced intelligence, helping organizations make data-driven decisions. These tools have been essential in democratizing data and analysis, enabling workers to extract meaningful insights. Similarly, JS visualization libraries play a significant role in cutting-edge analytics and massive data collection, offering dynamic and interactive solutions for businesses.
Key Benefits of Data Visualization with JavaScript
We live in an era of knowledge explosion, where nearly every operation relies on data to enhance user experience. Sometimes, the best JavaScript chart solution we can provide is simply raw data, but tables and numbers can be tedious to read and difficult for users to extract actionable insights. Instead, using JS charts and other open-source data visualization tools, we can leverage the brain's ability to recognize and process visual data more efficiently.
With the right Data Visualization JavaScript Framework, developers can incorporate advanced features such as ordinal scales, power scales, and interpolators to create more effective and insightful visual representations. Here are some of the best JS visualization libraries to help you get started and seamlessly integrate high-quality data visualization into your applications.
The way you design the visualization and represent large data sets can have a certain impact on the interpretation by your reading public. Read Top 10 Best Practices for Data Visualization
Top 16 Data Visualization JavaScript Libraries
D3js
D3.js is a powerful Data Visualization JavaScript Framework for creating dynamic and interactive data visualizations in web browsers. It is one of the most popular and widely used JS visualization libraries. It is possibly the most well-known and broad technique for Data Visualization with JavaScript out there. D3 has worked to control documents that are dependent on information and bring data life into information utilizing HTML, SVG, and CSS.
D3's accentuation on web norms gives you the capacity of present-day programs without coupling to a restrictive system, joining representation parts, and a piece of information directed way to an arrangement with DOM control. It grants you to tie general information to a Document Object Model (DOM), and eventually apply information-driven changes to the report.
ChartJS
ChartJS is a famous Data Visualization JavaScript Library of open-source HTML 5 graphs for existing web applications appropriate for the canvas component. V.2 gives merge graph types, new outline hub types, and excellent animations. Structures are basic and vibrant with eight fundamental outline types, and you can consolidate the library with moment.js for the time hub. 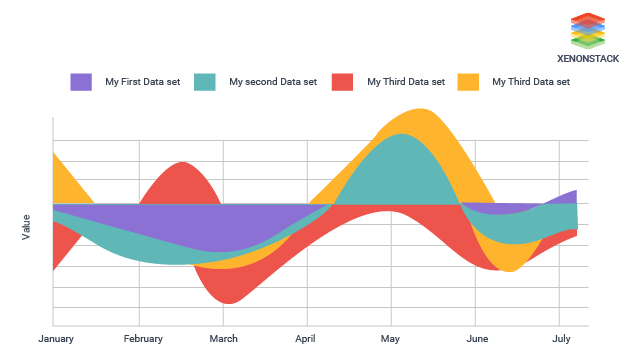
ThreeJs
ThreeJs is one of the best Data Visualization JavaScript Libraries for creating 3D animations and visualizations using WebGL. Its flexible and dynamic nature makes it highly useful for visualizing data in both 2D and 3D formats. For example, developers can use Three.js to create JavaScript chart solutions for 3D data representation with WebGL.
This JS visualization library enables the creation of GPU-accelerated 3D animations directly within web applications using JavaScript without requiring proprietary browser plugins. By leveraging WebGL, Three.js allows for high-performance data visualization with JavaScript, making it an excellent choice for interactive and immersive data experiences.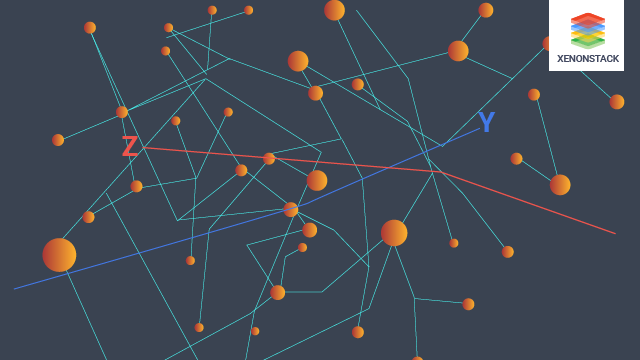
Echarts
Baidu's Echarts venture is an intelligent diagramming and representation Data Visualization JavaScript Framework library for the program. It is written in pure JavaScript and depends on the render canvas library. Its platform rendering diagrams are Canvas, SVG (4.0+), and VML, in addition to PC and portable programs. ECharts can likewise be utilized with hub canvas on the hub for dynamic server-side rendering (SSR). It is well-documented in English and works excellently on a large number of datasets. 
Highcharts
Highcharts is one of the most encouraging data visualization JavaScript libraries to hit the scene recently. With its massive cluster of highlights, including seven layout types (line, pie, and bar among them), the quantity to zoom all through outlines, and tooltips for contributing more data about information focus. The library has numerous customization choices, and they're all around recorded on one page for simple referencing.
Highcharts JS is an 8K star and a broadly famous JavaScript outlining library dependent on SVG, with fallbacks to VML and canvas for old programs. This is one of the best Data Visualization Strategies utilized by 72 out of the world's 100 most prominent organizations, which makes it (possibly) the most famous JS outlining API on the planet (Facebook, Twitter). 
Metric-Graphics
MetricsGraphics.js is a library based on D3 for Data Visualization with JavaScript that is upgraded for picturing and spreading out time-arrangement information. It provides a straightforward method for creating regular kinds of designs in a principled, steady, and responsive way. This Data Visualization JavaScript Library now underpins line graphs, scatterplots, histograms, bar diagrams, and information tables just as highlights like floor covering plots and essential straight relapse. 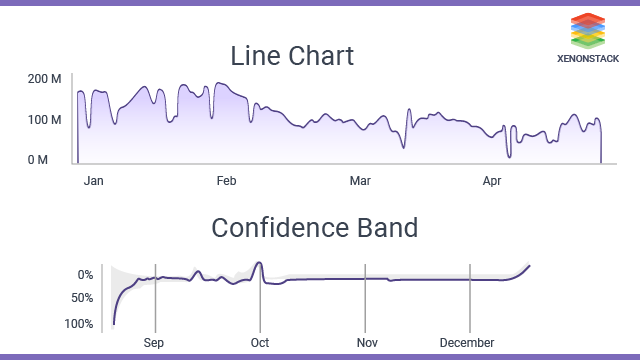
Recharts
Recharts is an effective way to do data visualization with JavaScript, made to react with clients. Recharts utilizes D3 in the engine and uncovered explanatory segments. This is one of the best Data Visualization JavaScript Libraries that truly light and render SVG components to create delightful, intelligent outlines. It is anything but difficult to use, and the documentation has an impact. The library gives local SVG support, lightweight reliance tree (D3 submodules) is exceptionally adjustable using part props. You can discover live models on the docs site. 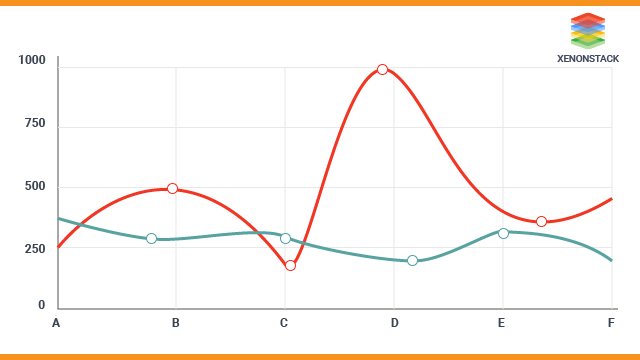
Raphael
Raphael is a 10k stars Data Visualization JavaScript Framework designed for working with vector graphics on the web. The library apportions the SVG W3C Recommendation and VML as a base for making structures, so every graphical thing is likewise a DOM piece, and you can append JavaScript create authority. Raphael, starting now, underpins Safari 3.0+, Internet Explorer 6.0+, Opera 9.5+, Chrome 5.0+, and Firefox 3.0+.
C3js
C3 is a D3-built-up adaptable chart library for web applications. The best Data Visualization JavaScript Library gives classes to all factors to define a characteristic style by quality and increase the structure equally by D3. Data Visualization with JavaScript additionally gives an assortment of APIs and callbacks to get to the condition of the graph. By utilizing them, you can refresh the outline considerably after it's rendered. 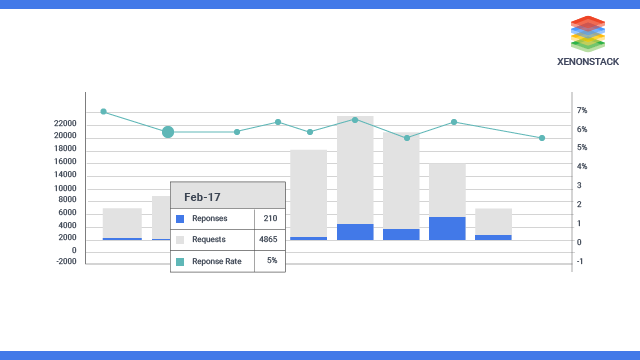
React Vis
React-vis is Uber's arrangement of React segments for steadily visualizing data, including line/zone/bar graphs, heat maps, scatterplots, shape plots, substantially, hexagon, and heat maps. The library does not require any past information with D3 or some other information vis library and gives low-level measured structure square parts, for example, X/Y hub. An incredible counterpart for working with Bit and a beneficial library to consider. 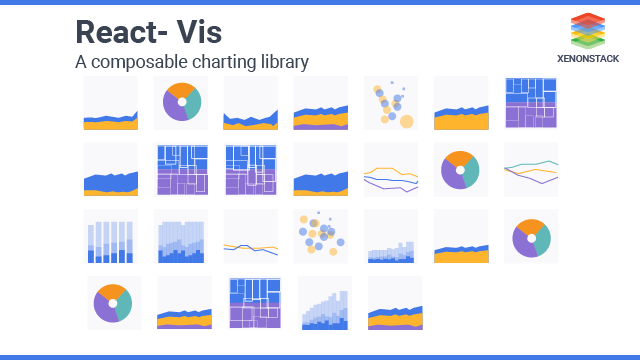
React Virtualized
React virtualized is a lot of React segments for productively rendering extensive records and forbidden information. ES6, CommonJS, and UMD fabricate are accessible with every dispersion, and the venture bolsters a Webpack 4 work process. Note that react and react-dom must be determined as companion conditions to stay away from variant clashes. Read some advanced Data Visualizations Techniques here. 
Victory
Victory is a selection of React composable React parts for building collective information representation, worked by Formidable Labs and with over 6k stars. Victory, a Data Visualization JavaScript Framework, utilizes a similar API for web and React Native applications for simple cross-stage graphing. An exquisite and adaptable approach to using React parts for functional information perception. I like it. These Data Visualization JavaScript Libraries are a neat sequence with Bit when utilizing singular parts to share and adjust them across applications. 
CartoDB
At Carto is a location intelligence and data visualization tool with a JavaScript apparatus that finds bits of knowledge and fundamental area information. You can transfer geospatial information (Shapefiles, GeoJSON, and so forth) utilizing a web frame and imagine it in a dataset or on a guide, search it using SQL, and spread map design spread Carto CSS. 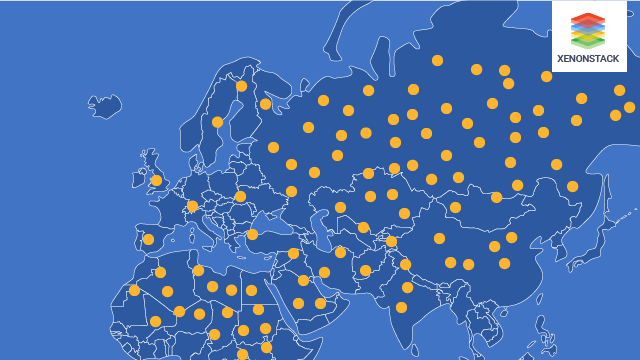
Raw graphs
Over Raw is an association interface among spreadsheets, and information perception works to make custom vector-put-together representations with applications at the top of the d3.js library. It works with forbidden information (spreadsheets and comma-isolated qualities), just as with reordered writings from different applications. In light of the SVG group, perceptions can be altered with vector design applications for additional refinements or directly inserted into site pages.
Metabase
Metabase is a somewhat fast and straightforward data visualization tool with a JavaScript approach to make information dashboards without knowing SQL (yet with SQL Mode for investigators and information advisers). You can make accepted portions and measurements and send information to Slack (and view the information in Slack with MetaBot), and the sky's limit. Most likely, an extraordinary apparatus to imagine information inside for your group, although some maintenance may be required.
tauCharts
tauCharts is a D3-based and information-centered outlining library. The Data Visualization JavaScript Framework provides a decisive interface for the quick mapping of information fields to visual properties. Its design permits you to construct aspects and expand outline conduct with reusable modules. 
Enhancing Web Design with JavaScript Data Visualization
Bringing data into meaningful information is a crucial aspect of web design. JS visualization libraries play a vital role in making data more interactive and engaging, especially for websites that rely on data presentation, such as financial advisors or real estate platforms.
Using data visualization with JavaScript, information can be transformed from static tables into dynamic and visually appealing formats. Instead of dull and overwhelming data tables, JavaScript chart solutions and open-source data visualization tools help users interpret complex datasets more effectively. By leveraging features like ordinal scales, power scales, and interpolators, developers can enhance the way data is displayed, making it more insightful and user-friendly.


