 Overview of Building Interactive Dashboard with Jenkins
- Jenkins is an open-source Java-based third-party server, which provides a content-based dashboard.
- It helps organizations to build, test, and deploy projects automatically for each & every change and commits they made in their files or projects.
- React-D3 is a Javascript library to build reusable components and interactive charts. React-D3 is a highly composable and declarative chart library, creates different types of charts such as line chart or bar chart and many more.
Challenges for Building the Dashboard
Jenkins already offers a handful of third-party dashboards with many features that an organization and user need to builds, test, and deploy their software, but the existing dashboard is -- Less Interactive and Flexible.
- No Proper listing of projects, jobs, builds, and builds status.
- Content-Based Dashboard with fewer visualizations.
Solution Offerings for Building the Dashboard
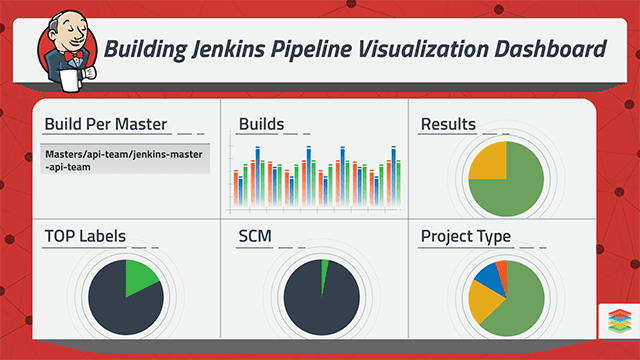
- Implement a Read-Only dashboard for Jenkins using Jenkins REST API for data, and React.JS and D3.JS Charts to build a flexible, interactive, graphical Jenkins Dashboard.
- First, integrate D3 Charts Library with the React Application.
- Use Jenkins REST API and manipulate to visualize different types of charts and data in the dashboard.
- Responsive, Cross browser & flexible Dashboard UI.
- Manipulate the REST API data as per requirement.
- Live data update according to the existing Jenkins Dashboard.
- Graph-based view of data using React D3 Charts libraries.
- Filter based view of data(like last 15, 30 days, or custom date range, builds status & many more).
- Quickly get the status of last committed changes or jobs and many more.
Building and Monitoring Jenkins Pipeline
Jenkins Pipeline Architecture
- Configure a build environment.
- Check the code.
- Build code without using environment specific settings for the build process independent of the environment.
- Perform quality controls consisting of running tests and code quality checks.
- Code Deployment on Continuous Integration environment.
- Run functional tests and deploy code on the testing environment.
- Code deployment on the User Acceptance and Production environment.
Features of Jenkins Pipeline
- Continuous Integration and Continuous Delivery Automation.
- Reliable and Efficient.
- Iterative Development and Access Control.
- Multi-branch Pipelines.
- Elimination of manual job creation and management.
- Version Control.
- Extended and Integrated with other plugins
Monitoring and Visualizing Jenkins Pipeline
- Visualize job duration metrics.
- Use Real Jenkins Pipeline.
- Develop Pipeline as Code.
- Logical Segmentation of Pipeline called as Stages.
- Branch Pipeline in parallel steps.
- Acquire nodes within parallelism.
- Don't use input within node block.
- Time Out plans for inputs.
- Don't set environment variables with global environment variables.
- Downstream Buildview Plugin to visualize.
- Display status and progress of selected jobs.
- Support job view filters and build view analyzer.
- Support Claim Plugin to find broken build.
.webp?width=1921&height=622&name=usecase-banner%20(1).webp)


