Why Telecom Analytics is necessary?
In the Telecom industry sectors, the customer's primary requirement is to get the service's excellent service performance before investing in their organization. Customers also want to know about predicting the revenue, sales, and growth of the industry through which they get ideas. Further, the customer wants to get detailed insights about the sectors and their performance with the usages and market shares. Machine learning models help them predict year-to-year growth and sales. The benefits of artificial Intelligence in telecommunication due to which data analytics in the industry is necessary.Solution
- With Xenonstack Support, one can build an accurate and predictive model on real-time data to better understand the revenue, consumer monthly, and the Telecom industry's growth and performance.
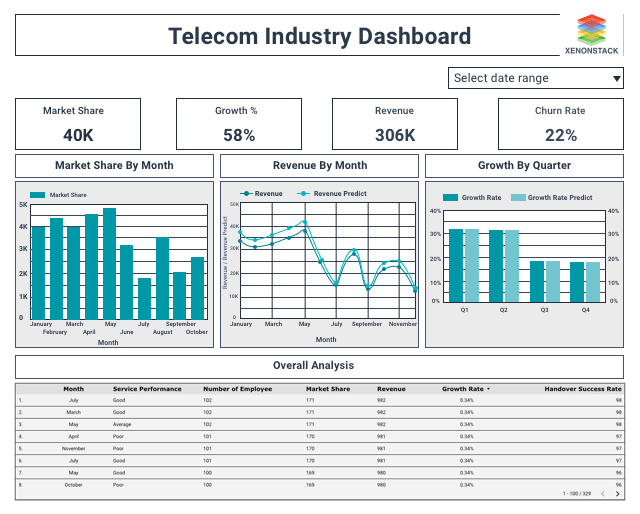
- As a result, we have given a demo of dashboards for reference; you will be confident after getting the revenue results, churn rate.
- The user will also quickly get the status of the telecom industry churn rate. Using this model, the user can quickly get information about the industry's overall analysis here; data sources will get from the telecommunication industry like BSNL, Reliance, JIO, etc.
Why Xenonstack?
Click on the button and request us to give you the demo of our Machine Learning model to show you the services, revenue, and growth status. Our model will provide you an accurate model to get the overall data analysis of the telecom industry. The customer gets the market share status, etc., by applying the model with narrative addition.Dashboard for Telecommunication Analytics


Description
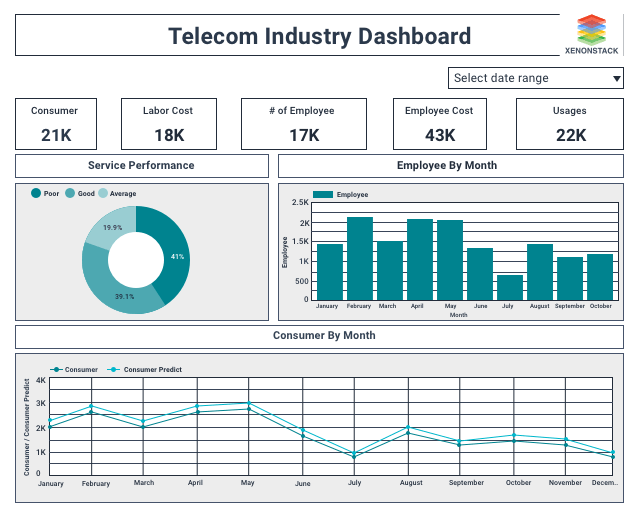
Described below are the benefits of an AI-enabled Analytics dashboard for the Industry.- Here our dashboard shows the service performance; here, we can see 39.1% service percentage is Good, here we will also get the information about the growth rate quarterly.
- The user will also get information about the organization revenue, employee, total subscribers, how much the telecom industry is paying to employees.
- Their usages about the churn rate are around 22%. The user will get the overall analysis of the employee, their service performance, market shares, revenue, growth, and the industry's handover success rate.


